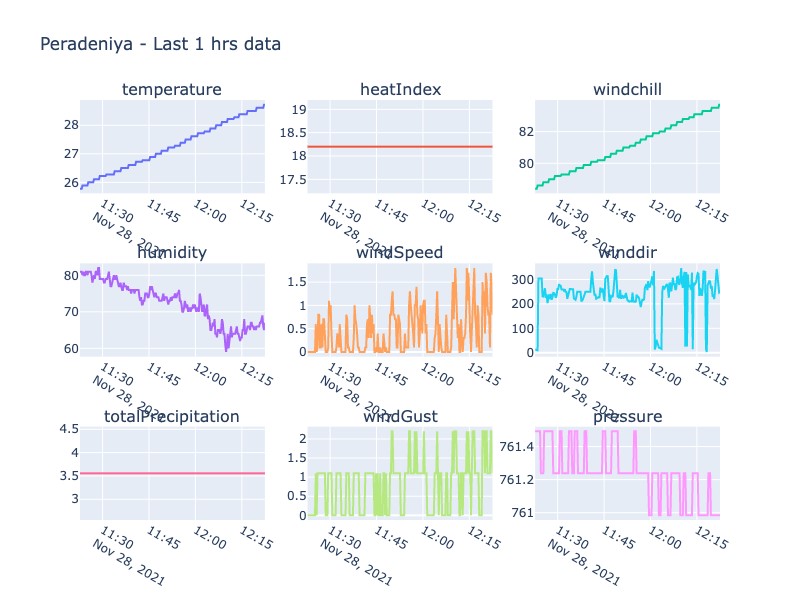
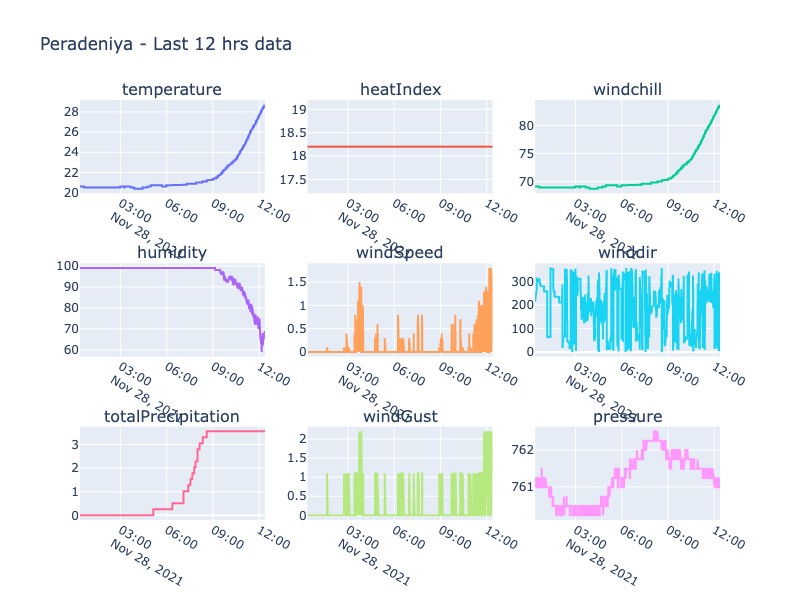
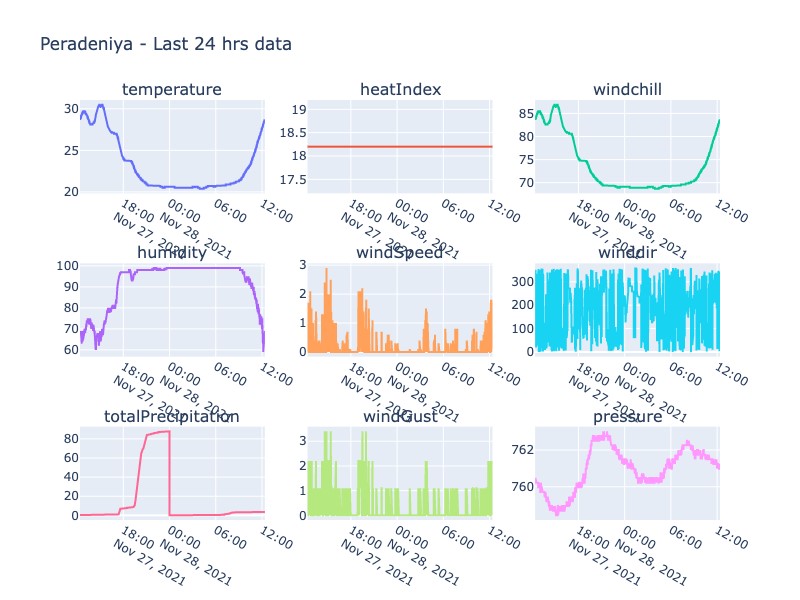
The data from the weather stations is made available as graphics or data tables. The plots of last one hour data, last 12 hour data or last 24 hour data can be readily viewed below.
Data also can be downloaded as tables through the provided interface. A typical data set is shown in the following table. Data are reported roughly every 15 seconds and the following table covers about 2 mins of duration.
|
Time (UTC) |
Time (Local) |
Windspeed |
Humidity |
Temperature |
Heat Index |
Wind Chill |
Wind Gust |
Total Rain |
Pressure |
|
2021-11-28 07:16:11 |
2021-11-28 12:46:11 |
0.000000 |
66.0 |
29.1111 |
18.2 |
84.4 |
0.00000 |
3.556 |
760.984 |
|
2021-11-28 07:16:27 |
2021-11-28 12:46:27 |
2.101090 |
65.0 |
29.1111 |
18.2 |
84.4 |
3.40197 |
3.556 |
760.984 |
|
2021-11-28 07:16:43 |
2021-11-28 12:46:43 |
0.701853 |
64.0 |
29.1111 |
18.2 |
84.4 |
1.09972 |
3.556 |
760.984 |
|
2021-11-28 07:16:59 |
2021-11-28 12:46:59 |
0.701853 |
64.0 |
29.1111 |
18.2 |
84.4 |
1.09972 |
3.556 |
760.984 |
|
2021-11-28 07:17:15 |
2021-11-28 12:47:15 |
1.698750 |
65.0 |
29.1111 |
18.2 |
84.4 |
2.19944 |
3.556 |
760.984 |
|
2021-11-28 07:17:31 |
2021-11-28 12:47:31 |
1.502050 |
67.0 |
29.1111 |
18.2 |
84.4 |
2.19944 |
3.556 |
760.984 |