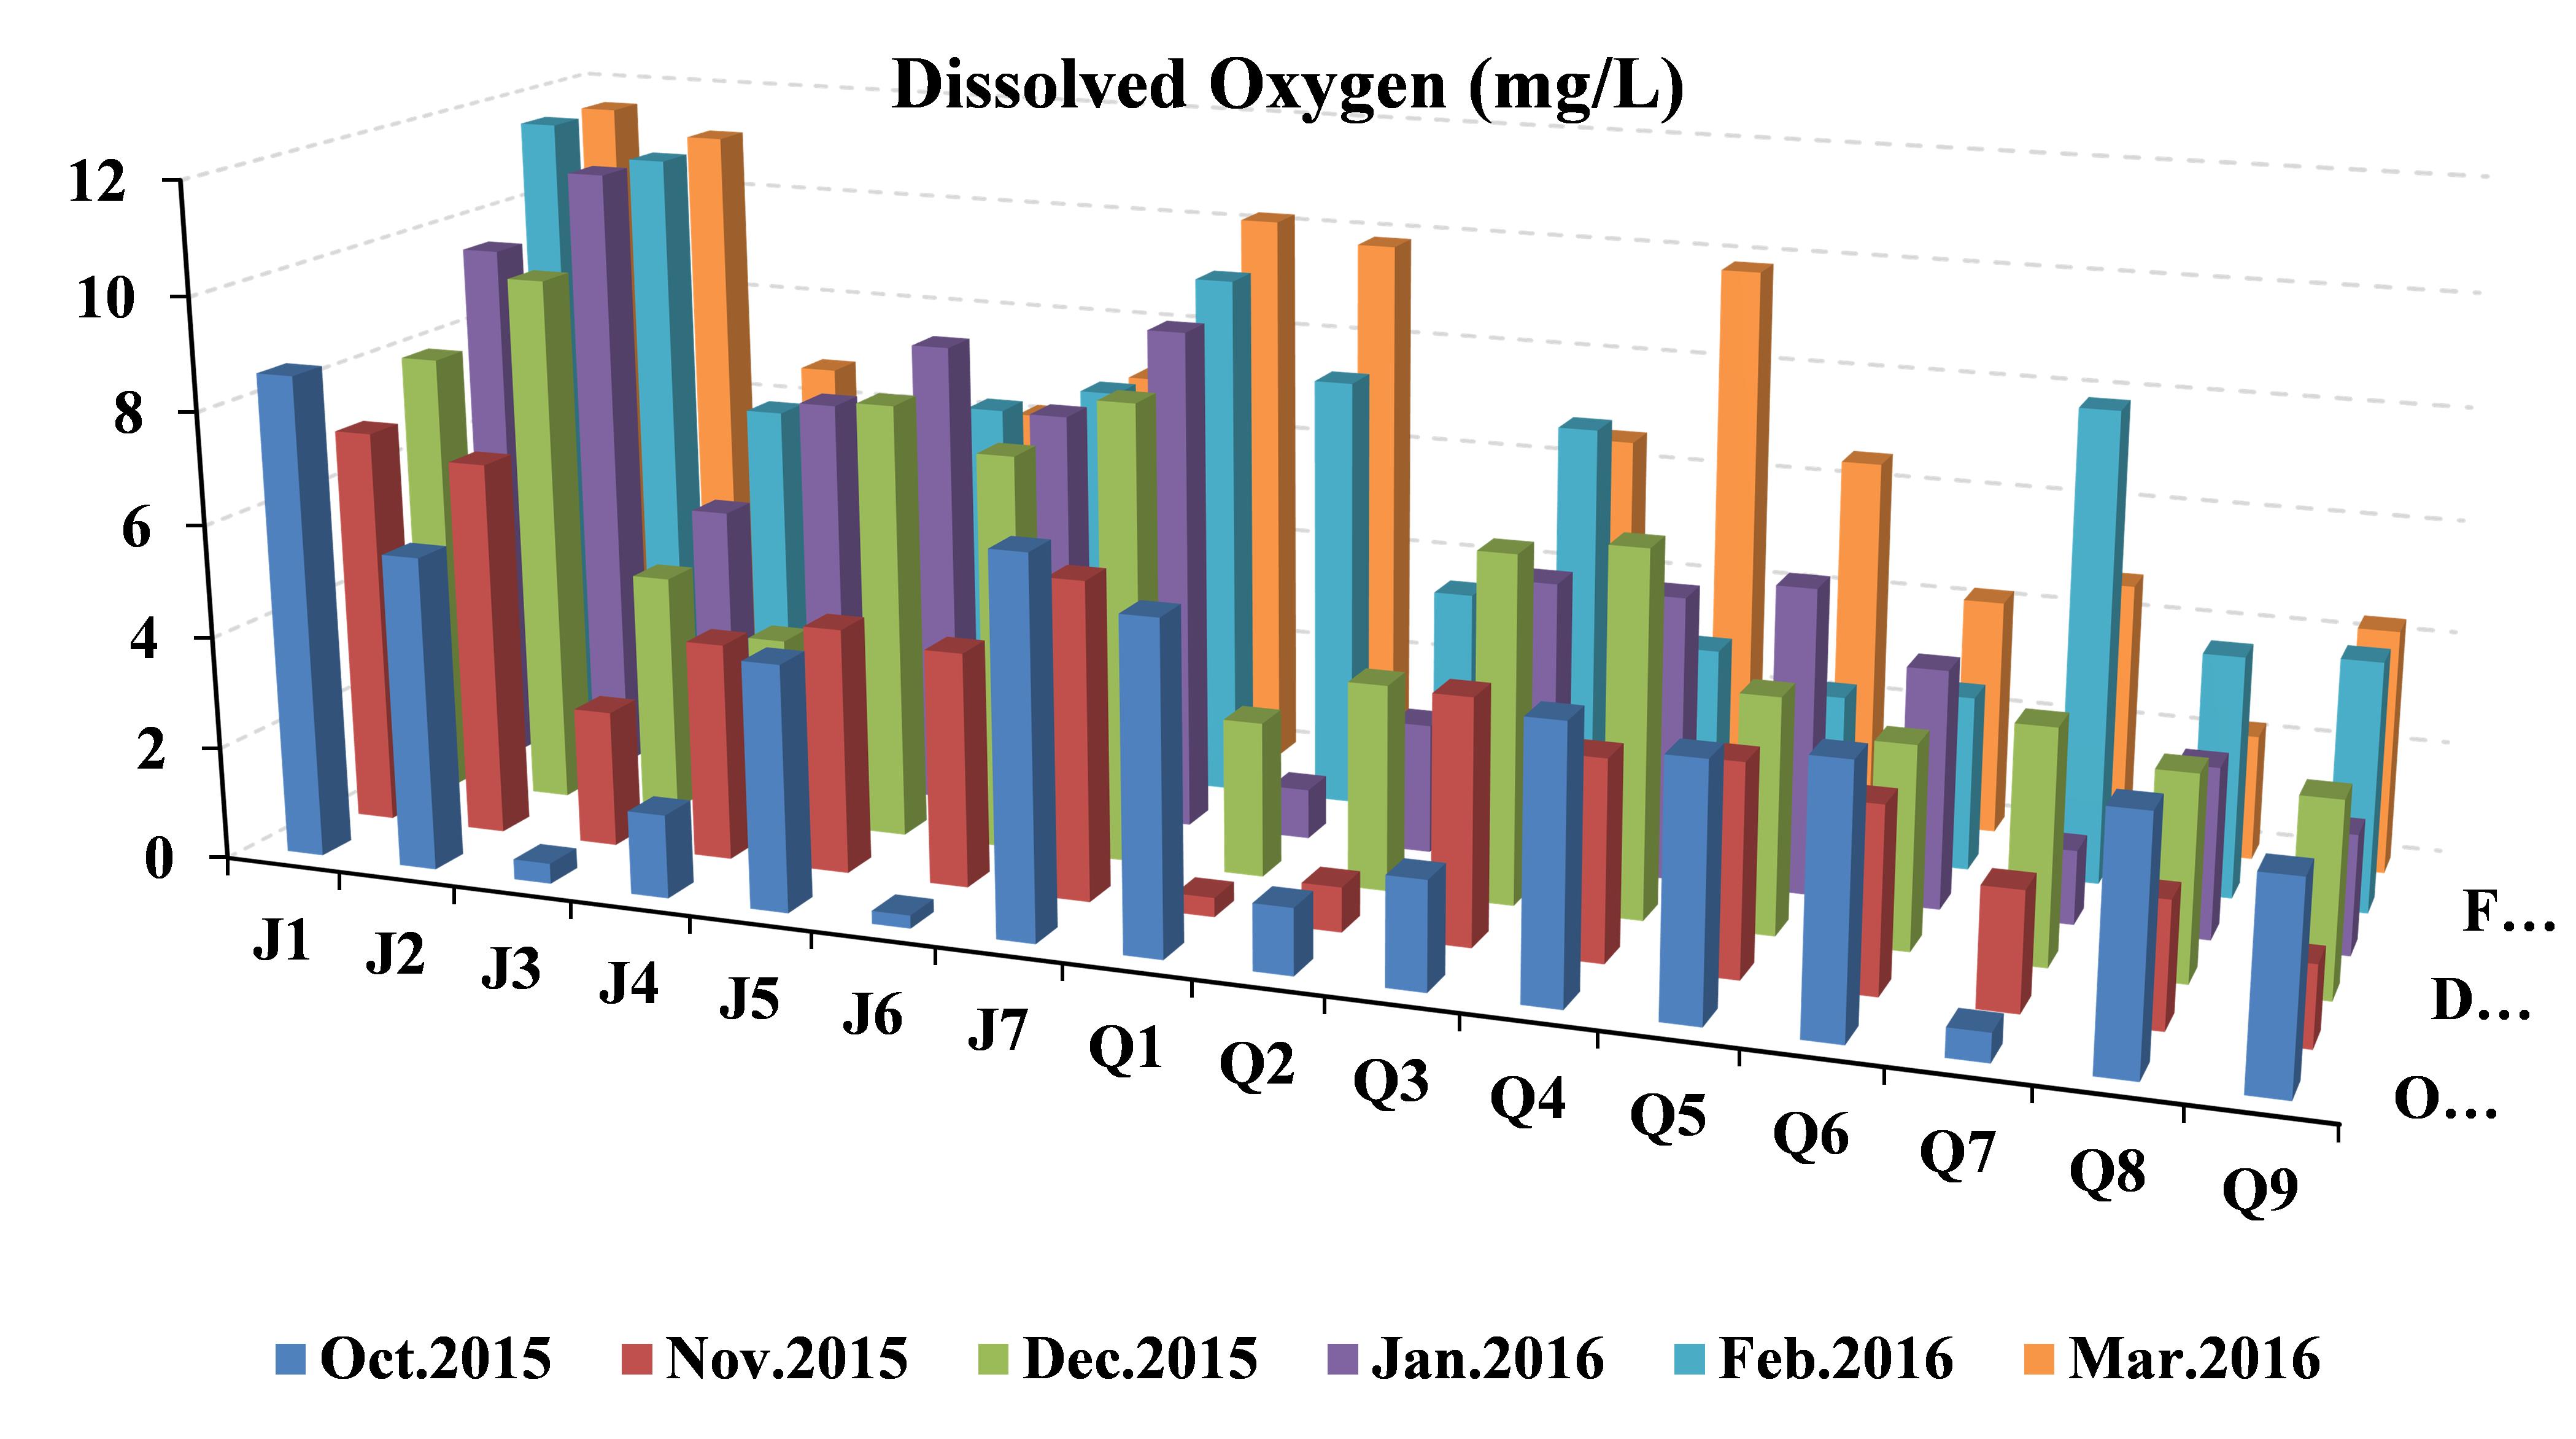
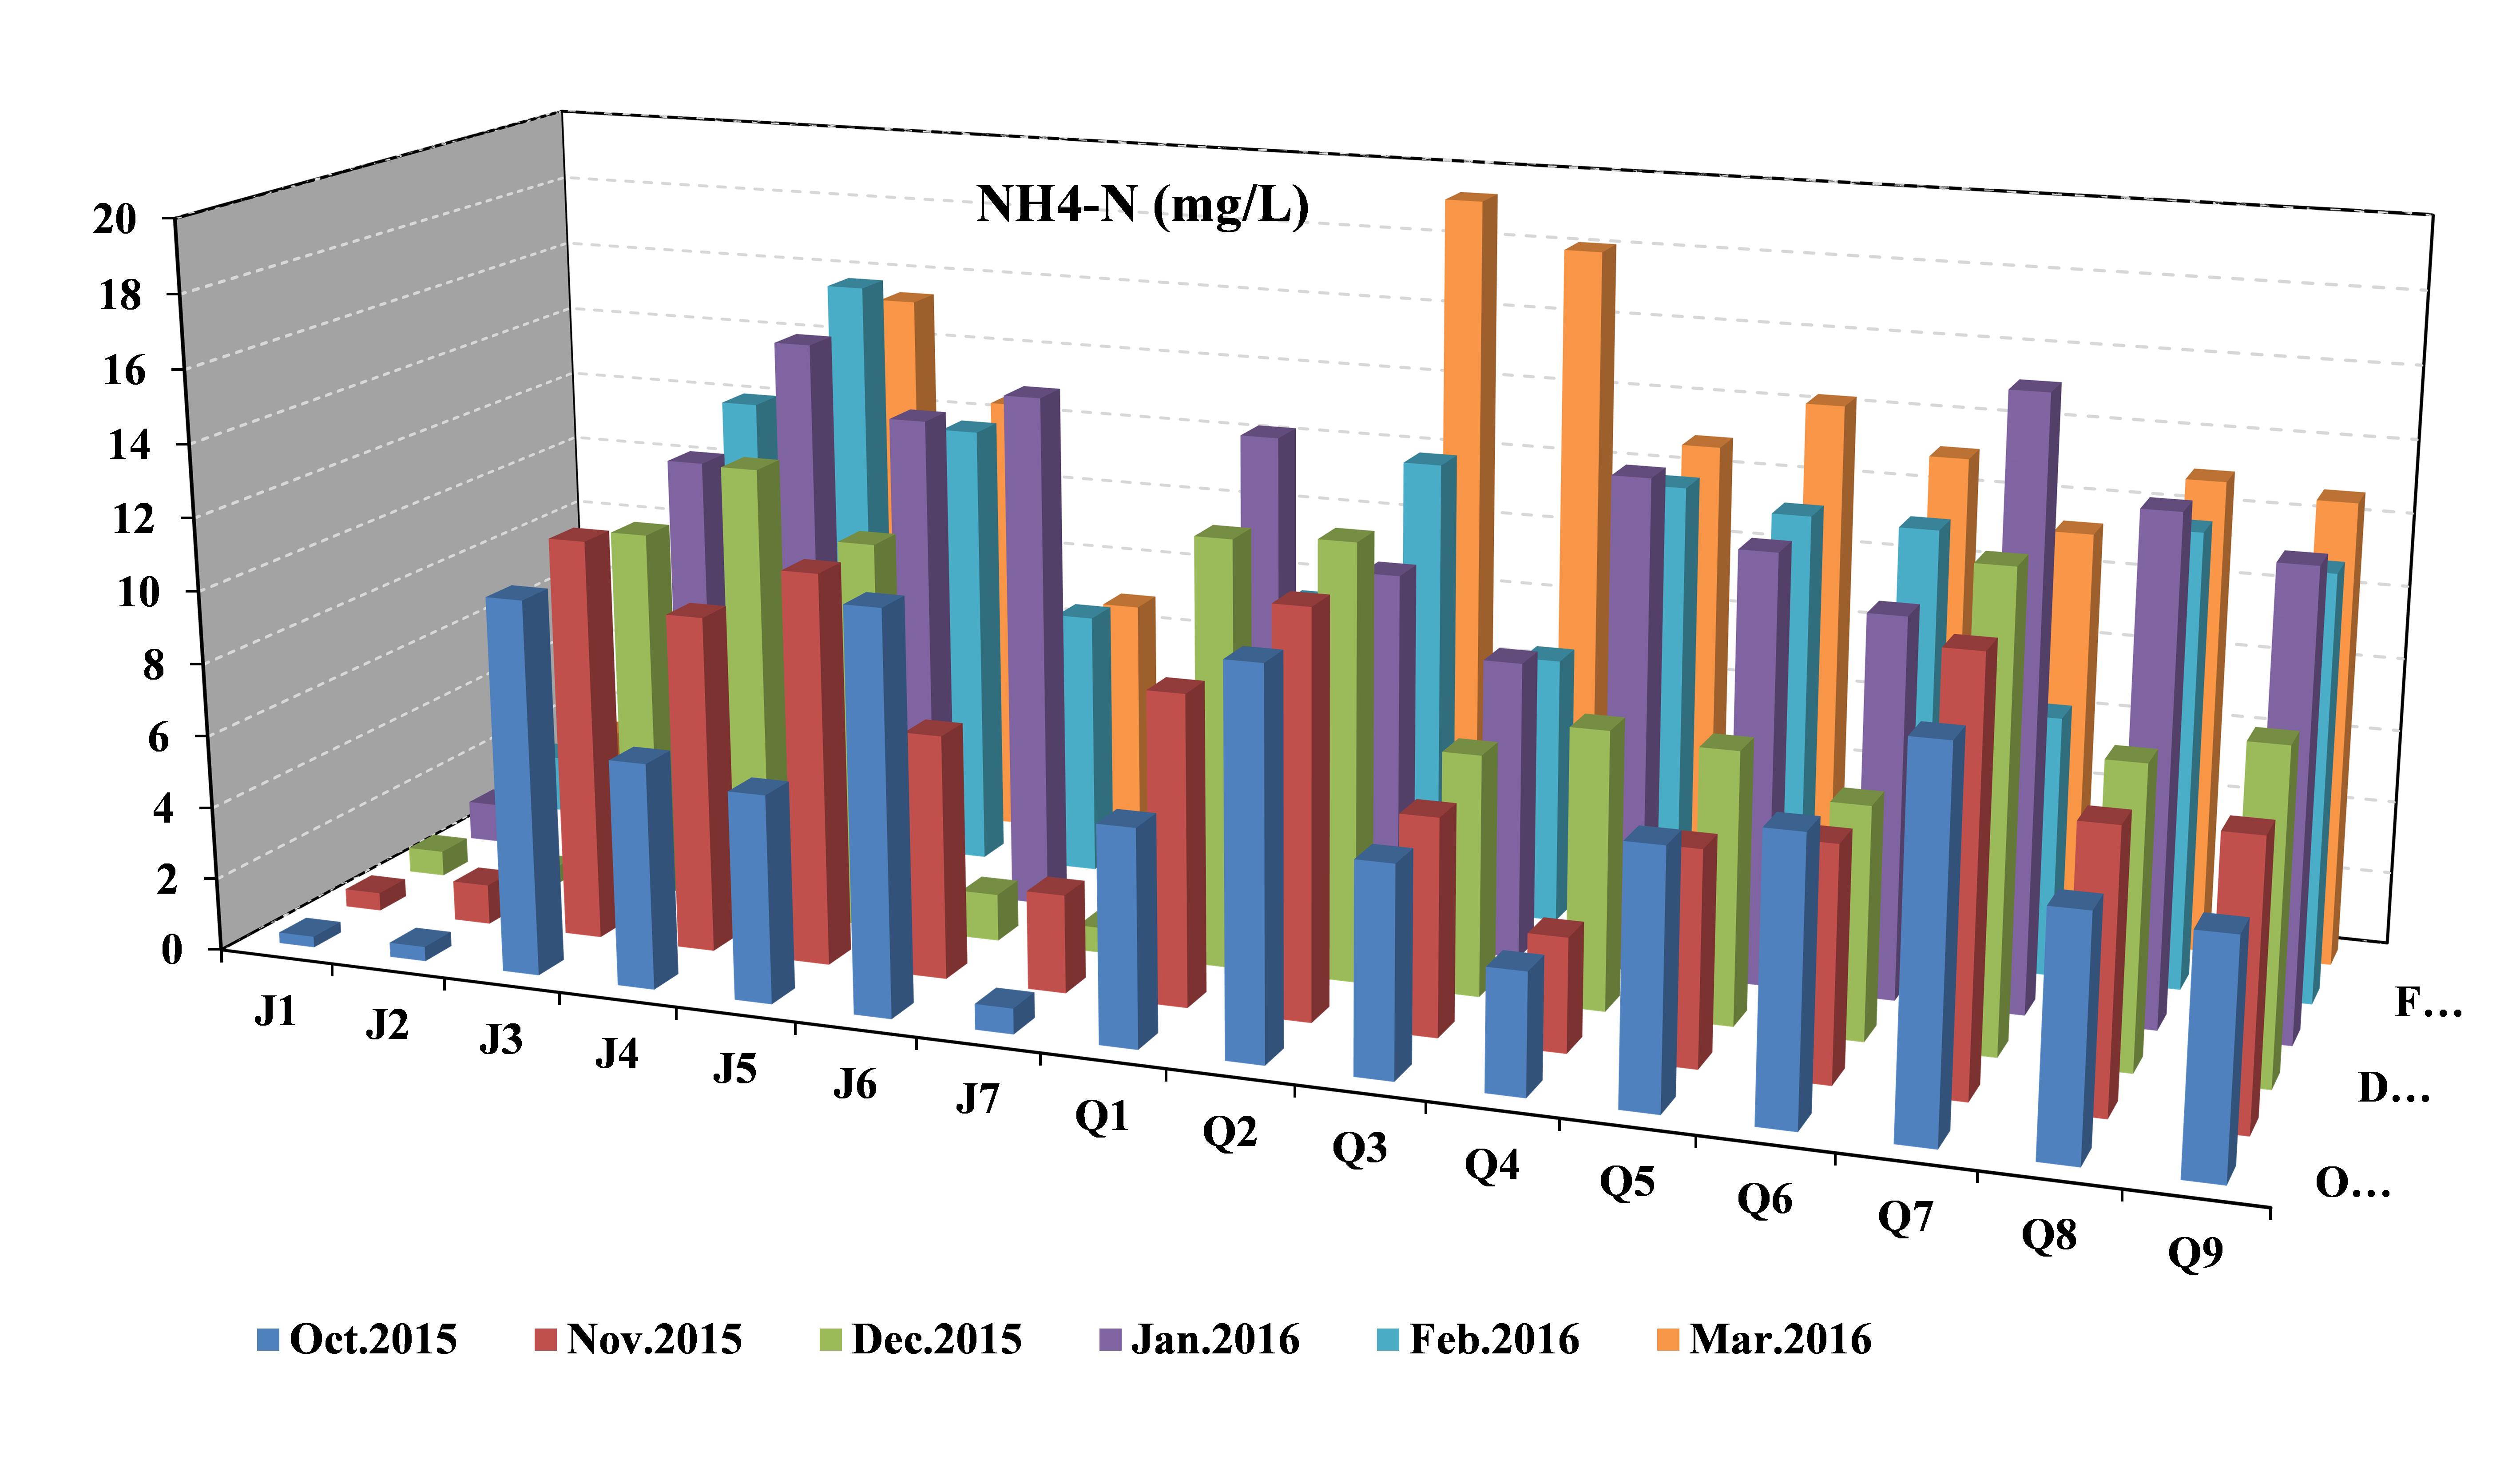
The data and information was targetted to cover the Qinhuai River basin where the Guanghzou City inside. In summary, below is the list of the data which have been collected and analyzed:
- GIS data: landuse, river system networks, hydrotopography, water quality observation stations; population density; administrative boundaries.
- Hydro-meteorological data: daily rainfall, maximum air temperature, mean air temperature, minimum air temperature and relative humidity.
- Water quality for river and Industrial/domestic wastewater in each administrative region of Guanghzou
- Spatio-temporal variations of river water quality.
- Relationship between water quality and socio-economical development.
The scope of works of proposed consultancy services and the expected outcomes (Fig)
Distribution analysis for mean values
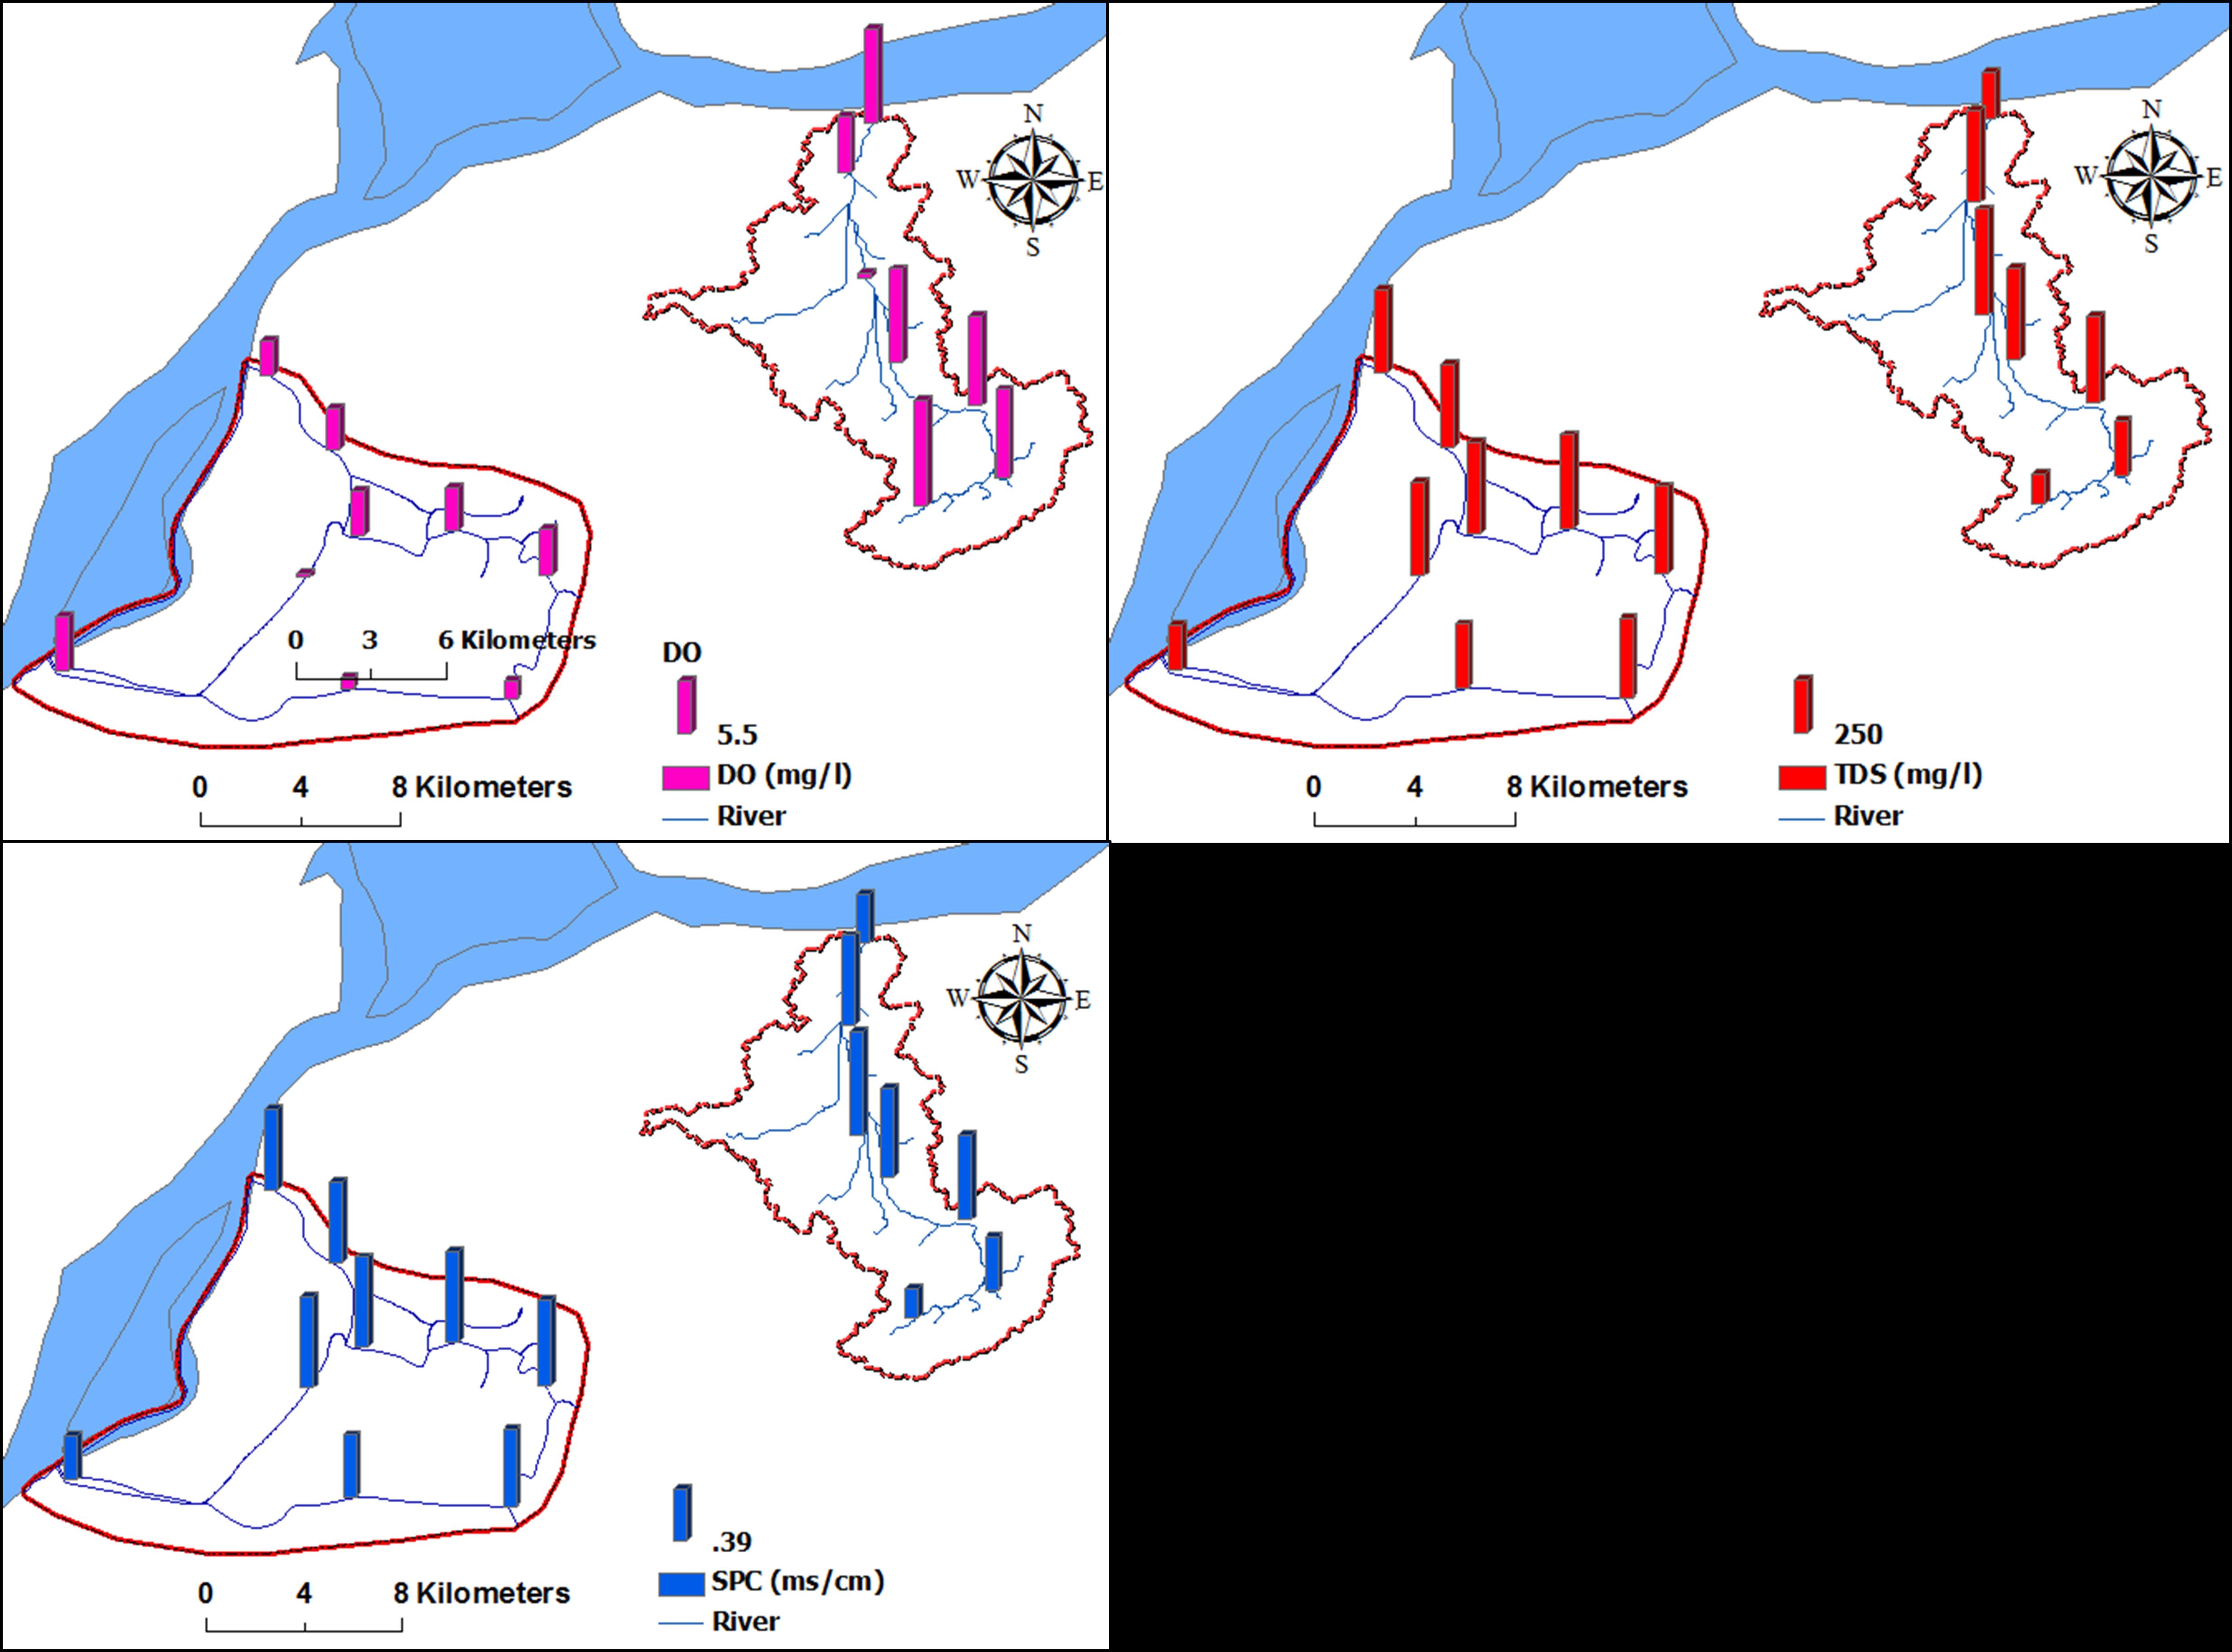
Water quality data for surface water, ground water, and industry have been collected for Guanghzou City. The example surface water quality data at 16 monitoring stations were shown in the below figures.
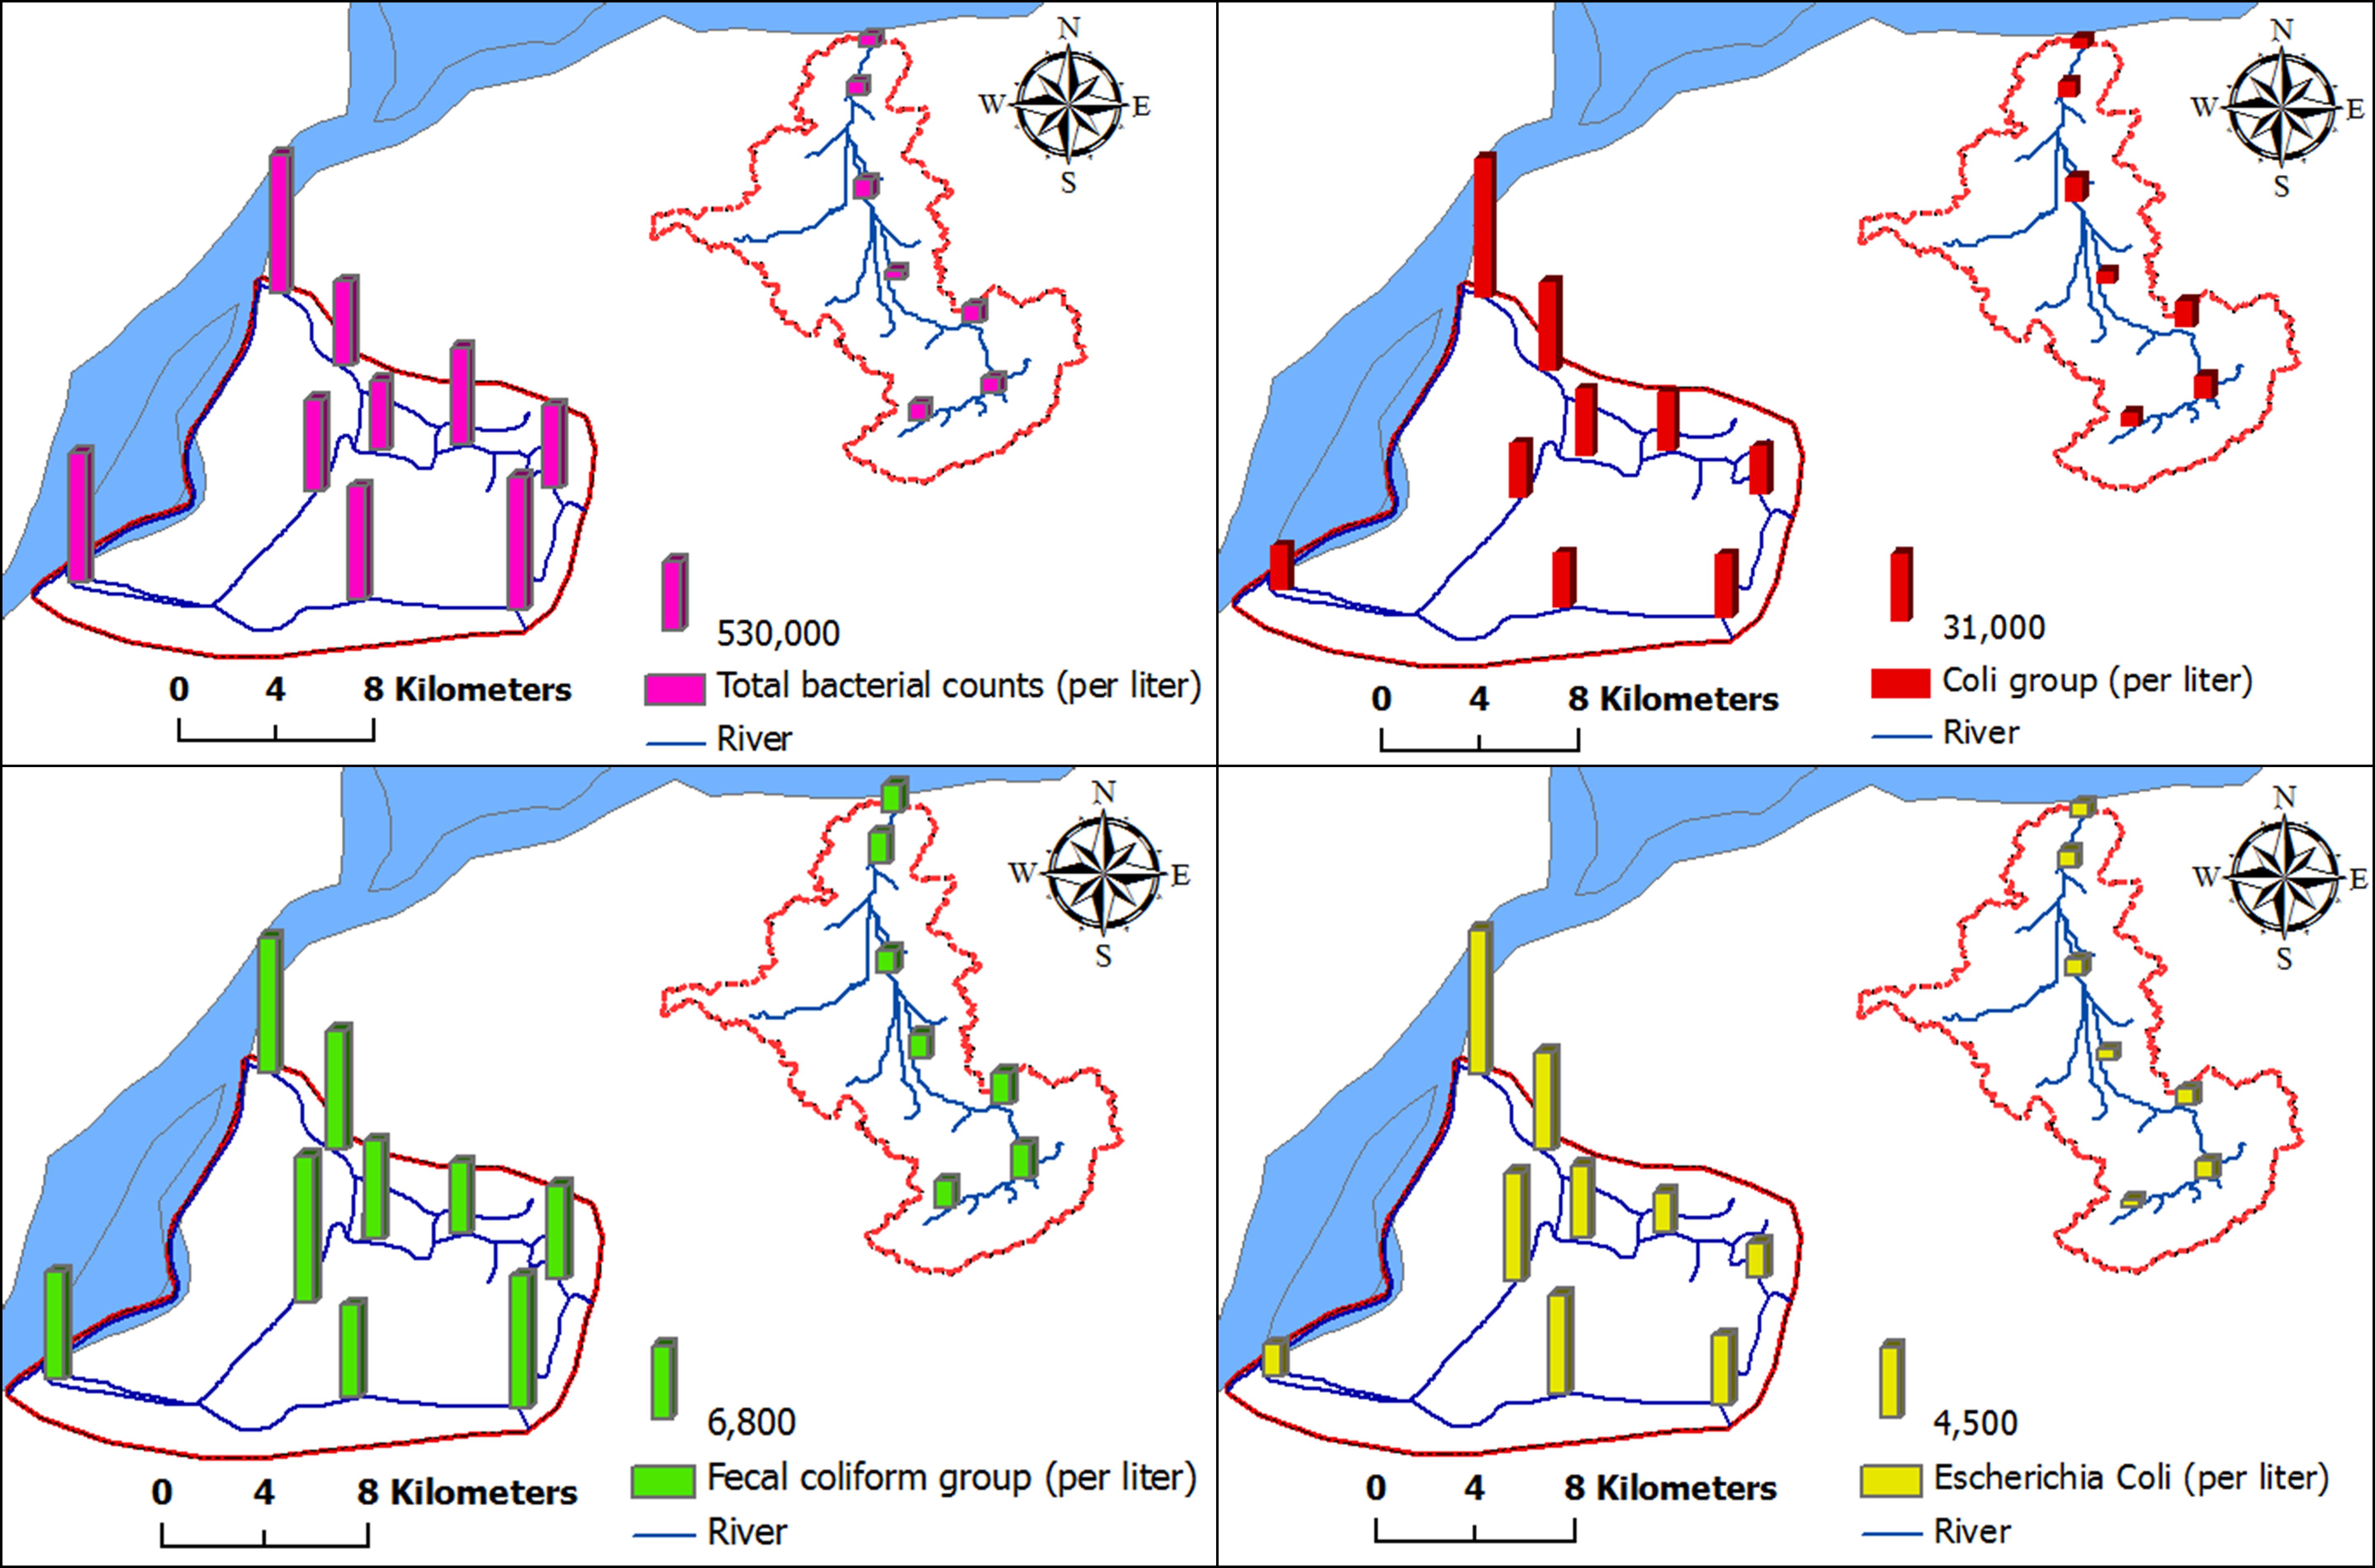
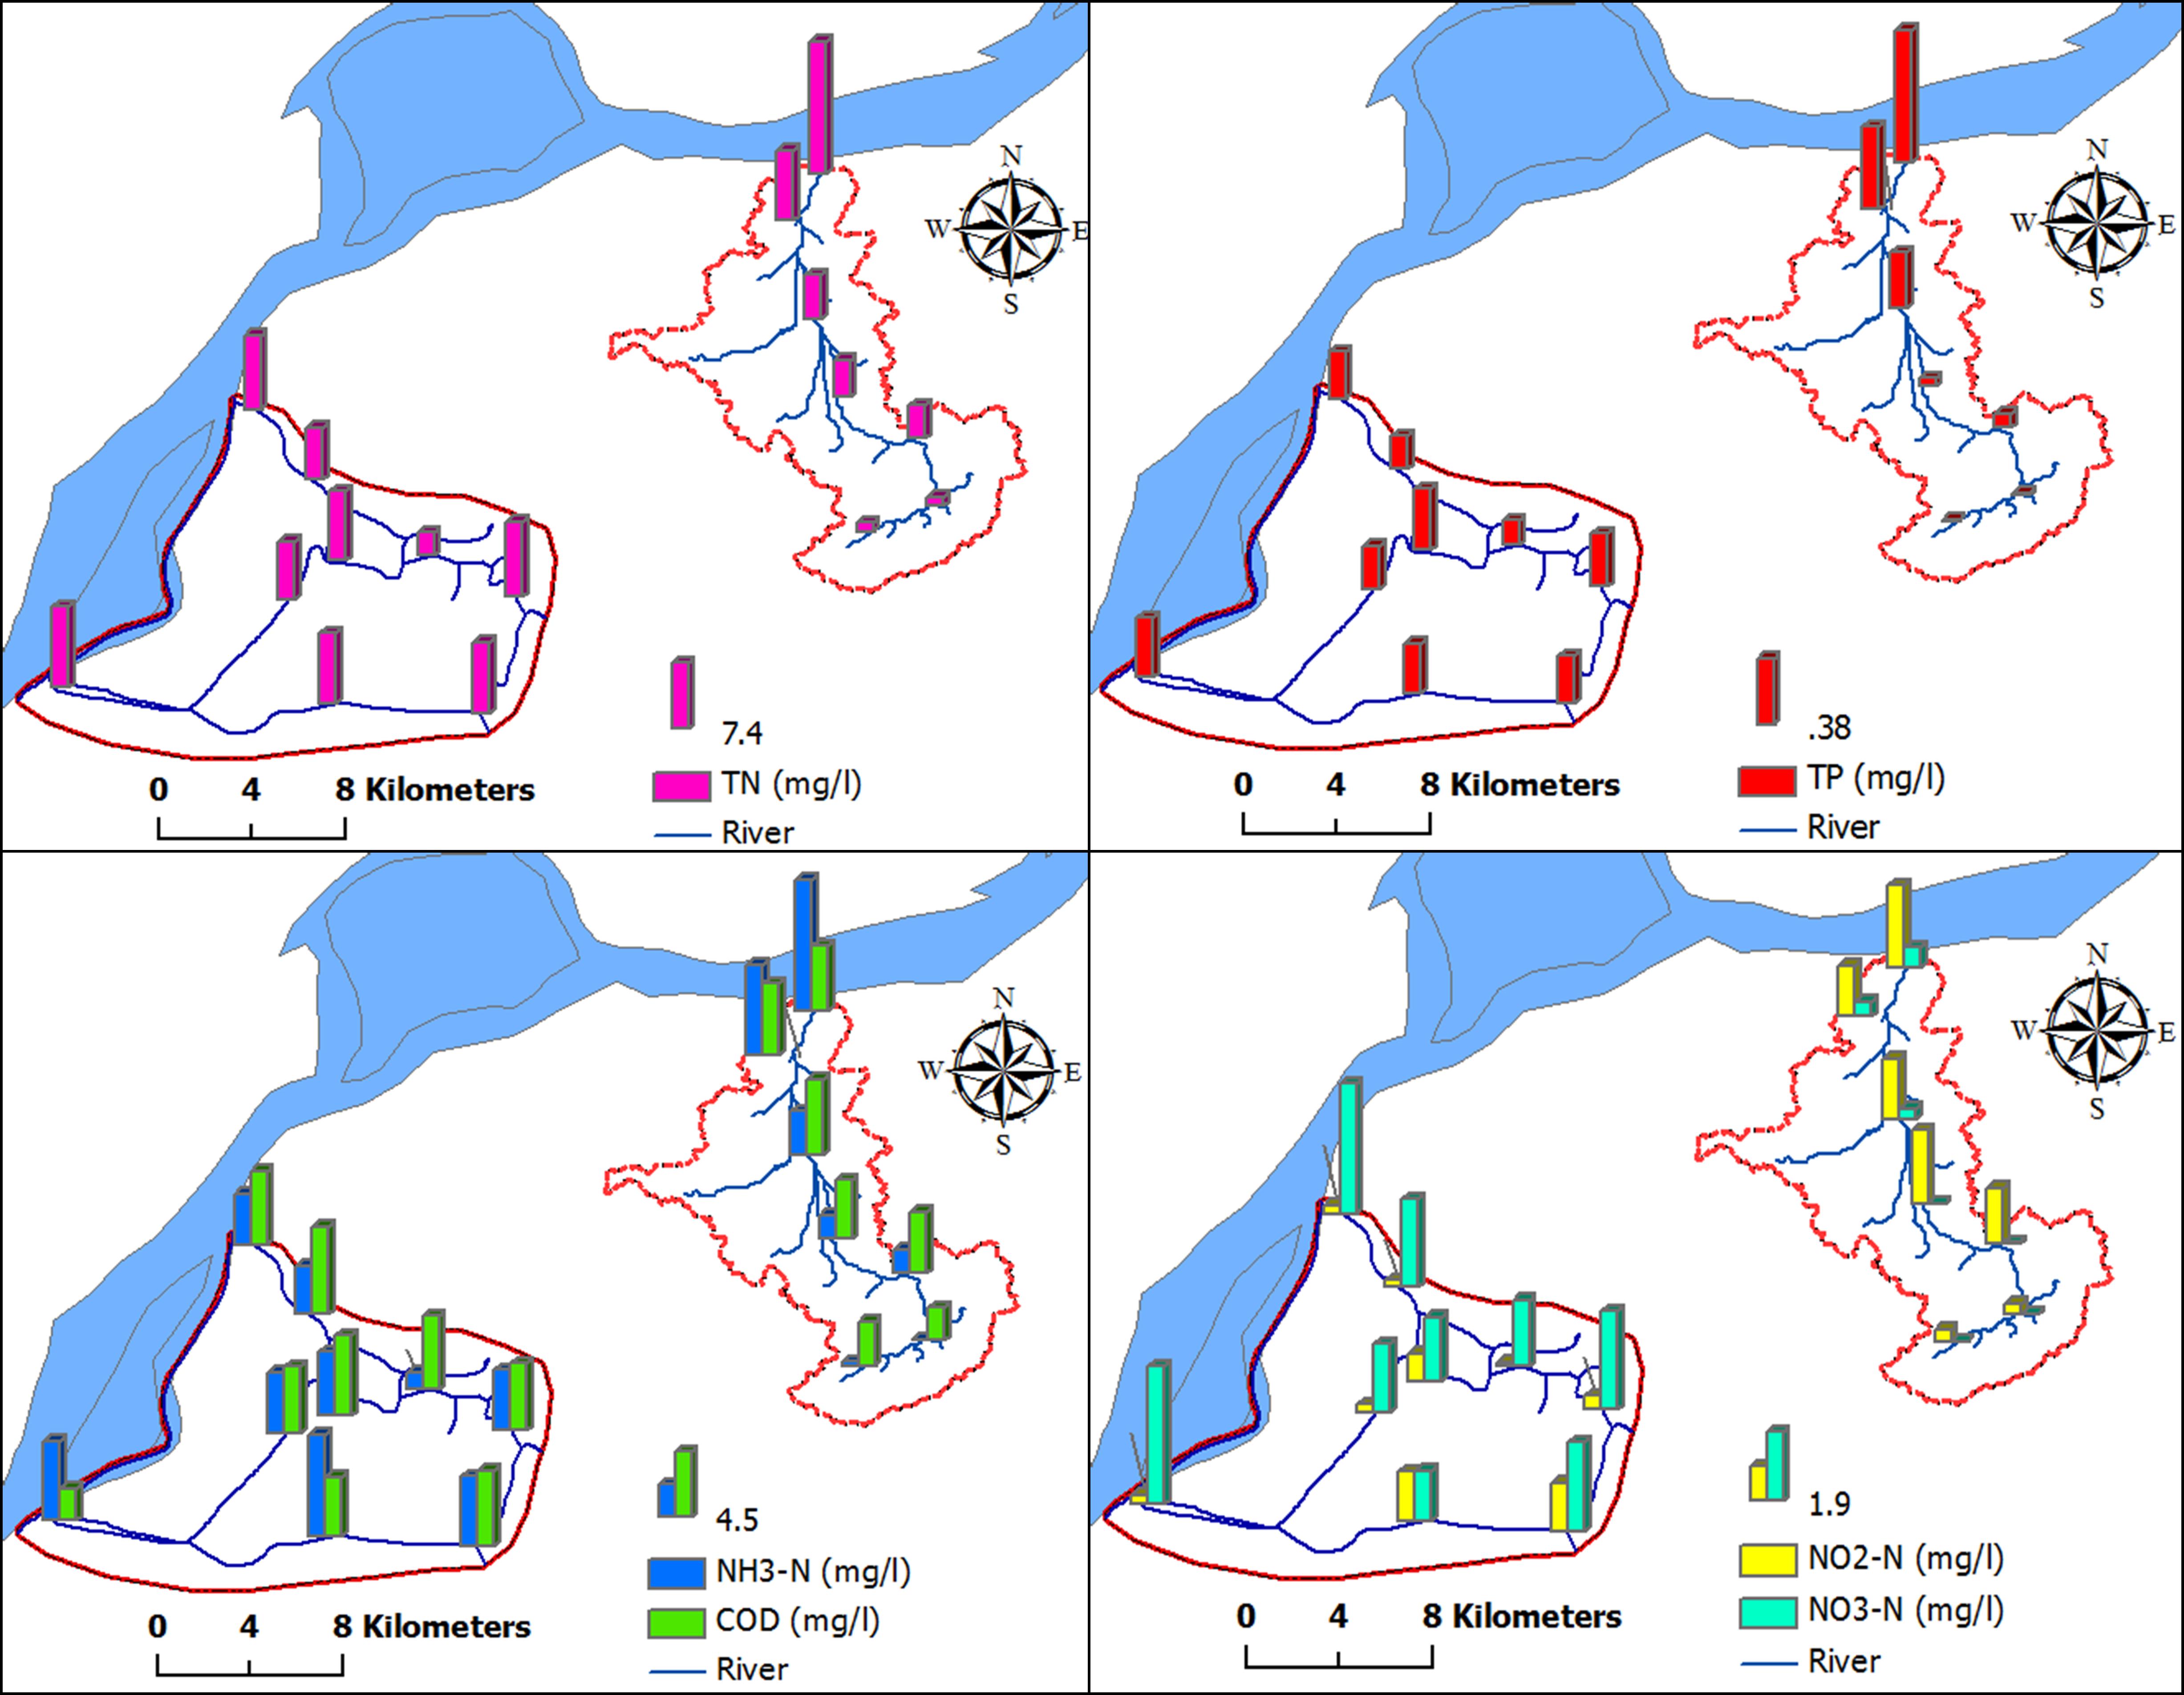
Time series analysis
Water temperature (℃) at total 16 studying stations in Downtown Area (Q1-Q9) and Zhucun River basin (J1-J7) from Jan.1, 2021 to Nov. 30, 2021. (Fig)
Conductivity (mS/cm) at total 16 studying stations in Downtown Area (Q1-Q9) and Zhucun River basin (J1-J7) from Jan.1, 2021 to Nov. 30, 2021. (Fig)
TDS (g/L) at total 16 studying stations in Downtown Area (Q1-Q9) and Zhucun River basin (J1-J7) from Jan.1, 2021 to Nov. 30, 2021.(Fig)
