Rainfall and catchment response can be observed from the observation summary page shown below,
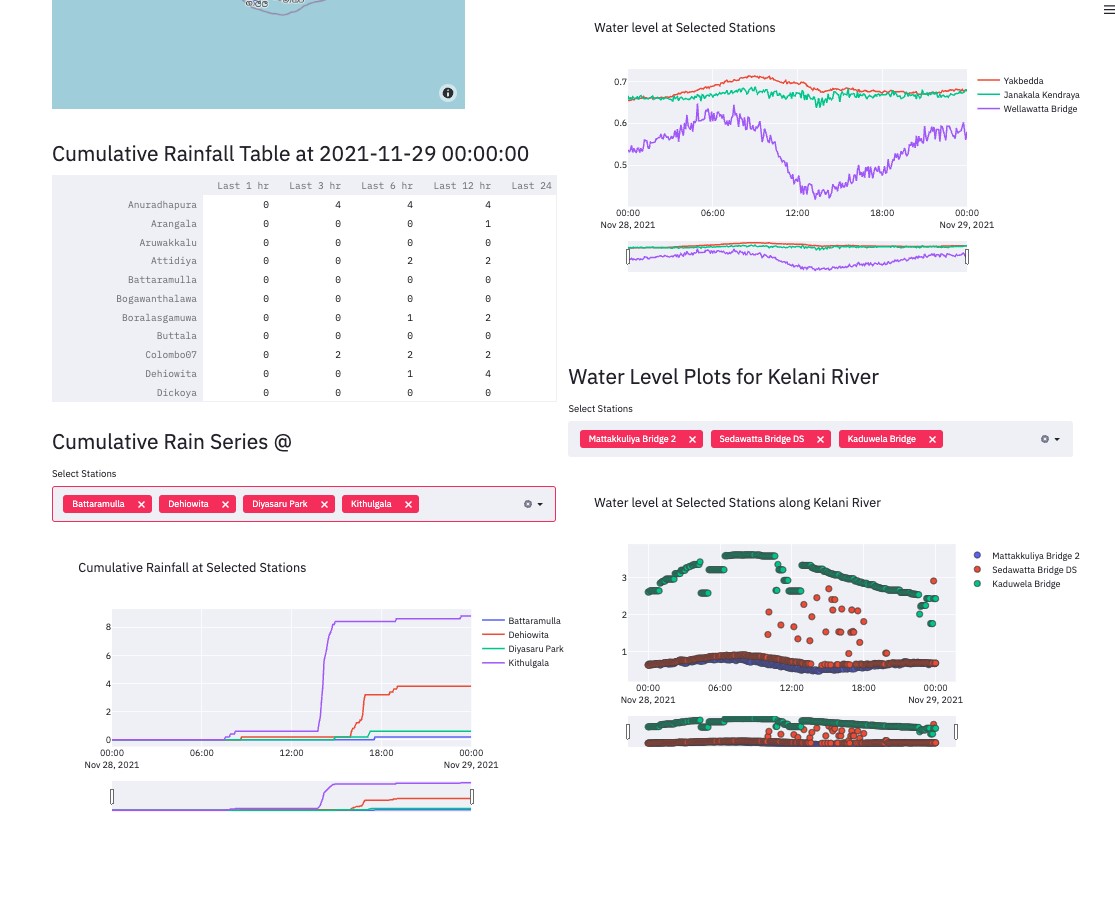
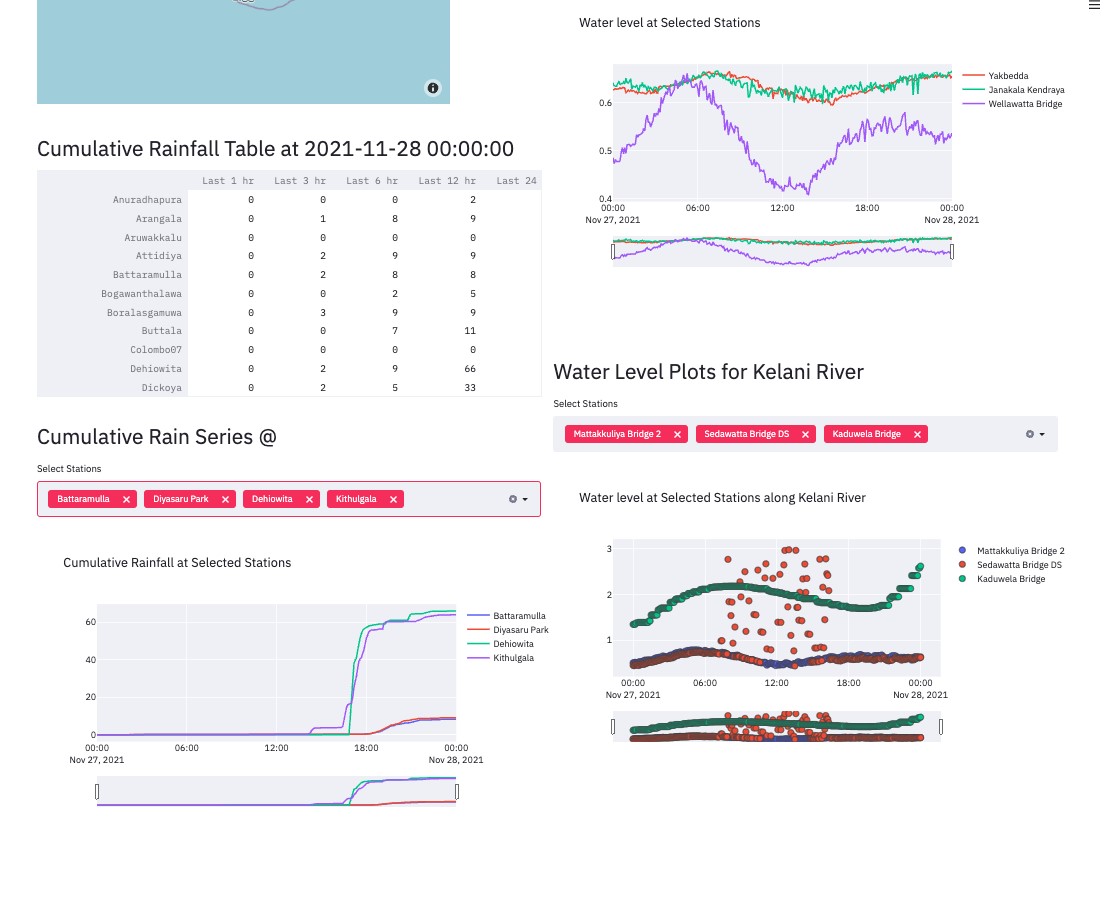
Below figure shows cumulative rainfall at each weather station and the range of water level fluctuation within the city drainage network as well as the Kelani River that drain the main catchment.
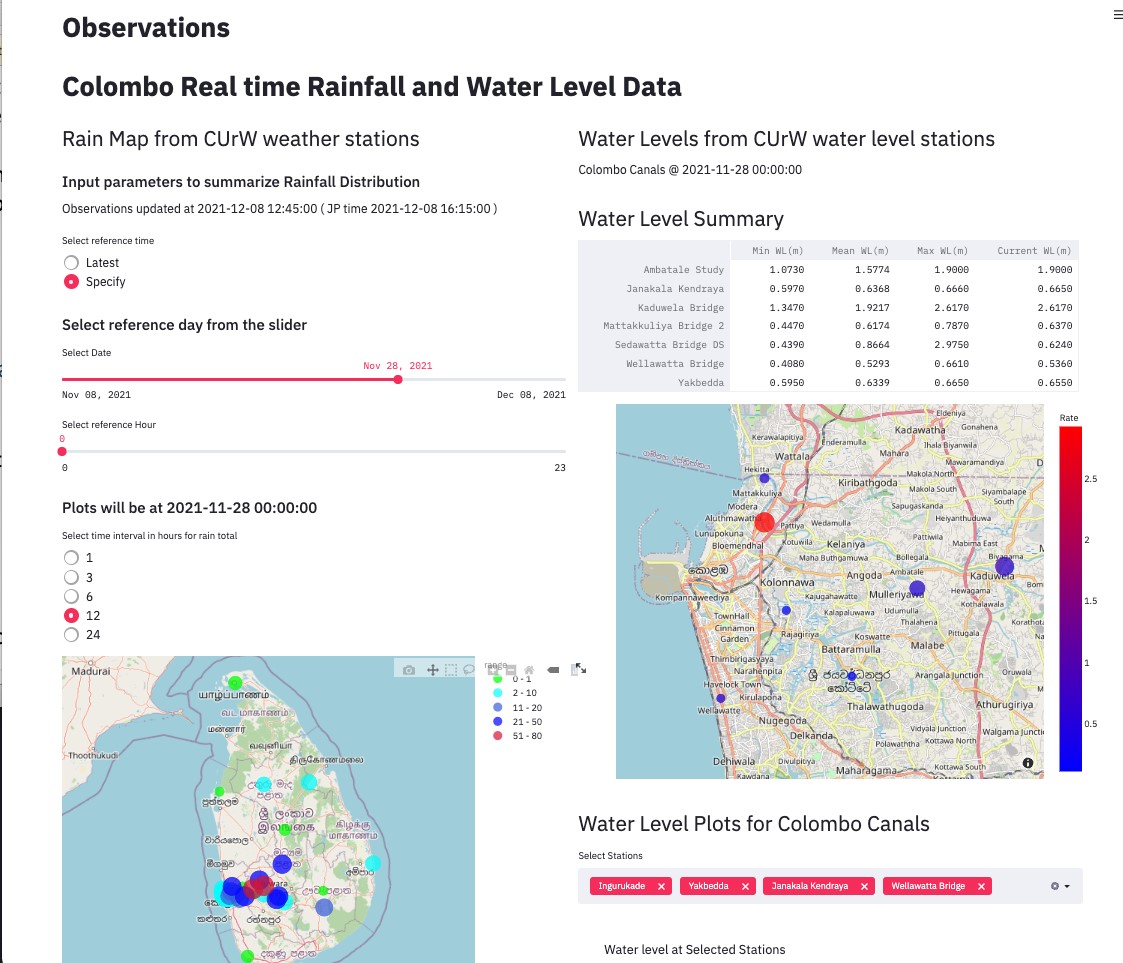
Upper portion of the dashboard figure showing rainfall and water level summaries
The cumulative rainfall in the upstream of the catchment response to this rainfall can be observed from the water levels shown in the same page
There is a lag time for the river water level to rise from a heavy rainfall in the upstream of the catchment. This gives sufficient time to close the gates to the city to prevent city flooding.